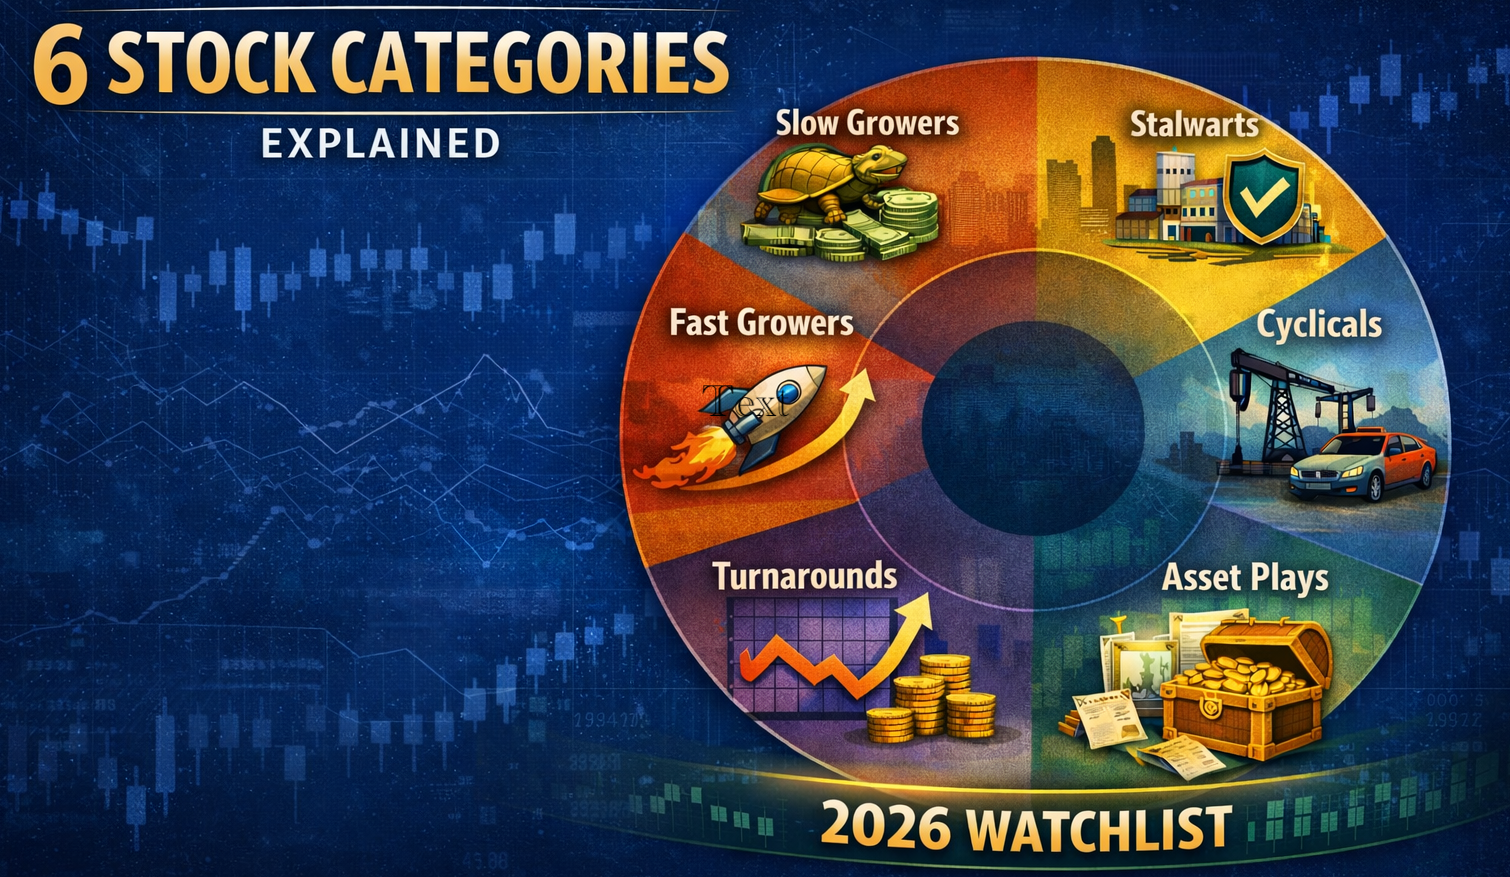
Peter Lynch’s 6 Stock Categories, Explained (With a 2026 Watchlist)
Peter Lynch’s One Up on Wall Street gives retail investors a practical framework that still holds up: classify a stock by “what kind of business it is right now,” then match your expectations, valuation discipline, and monitoring checklist to that category.
The core idea is simple: a great company can still be a bad stock if you evaluate it with the wrong lens. A cyclical isn’t a fast grower. A turnaround isn’t a stalwart. When you know the category, you know what matters.
Below is a clear definition of each category, how to think about it in the current market (Jan 2026), and a curated research watchlist.
1. Slow Growers
What they are
Mature companies with low single-digit growth; often driven by population growth, pricing, and modest share gains. They tend to return cash via dividends and buybacks. You typically buy them for stability and yield, not to “10x.”
What to watch
- Dividend safety and payout discipline
- Pricing power vs. input cost inflation
- Volume trends (are they shrinking?)
- Balance sheet resilience
Current watchlist ideas (2026)
PG, KO, PEP, KMB, CL, GIS, K, CPB, KHC, MO, PM, VZ, T, SO, DUK, AEP, XEL, ED
Example: PG
Why it fits: PG is a classic slow grower: dominant consumer brands, steady demand, and a shareholder-return profile where the bulk of long-term return often comes from dividends + modest earnings growth rather than explosive expansion.
What to watch (practically): pricing vs. volume (are price hikes sticking without volume erosion?), commodity/input-cost pressure, and dividend coverage through free cash flow.
2. Stalwarts
What they are
Large, durable franchises that still grow at a respectable rate; often mid to high single digits (sometimes more). These businesses usually have scale advantages, diversified revenue streams, and strong balance sheets. They are the “good companies at a fair price” bucket.
What to watch
- Consistency of earnings/FCF through the cycle
- Competitive moat durability
- Capital allocation (buybacks, reinvestment, M&A discipline)
- Valuation relative to normalized growth
Current watchlist ideas (2026)
MSFT, AAPL, GOOGL, AMZN, META, JNJ, UNH, MRK, ABT, TMO, COST, HD, MCD, JPM, V, MA, SPGI, ICE, HON, RTX, LMT, XOM, CVX, LIN
Example: Microsoft (MSFT)
Why it fits: MSFT is a textbook stalwart: massive scale, diversified revenue engines (cloud, productivity, enterprise software), and resilience through cycles. It still offers meaningful growth but typically with lower business risk than “pure” fast growers.
What to watch: Azure growth durability, operating margin trend (especially with AI capex), and whether buybacks/dividends remain consistent through investment cycles.
3. Fast Growers
What they are
Companies compounding revenue and/or earnings at high rates often 15–30%+ with a long runway. This is where “ten baggers” come from, but it is also where expectations are most punishing: if growth slows, the stock can compress hard.
What to watch
- Growth quality: retention, expansion, unit economics
- Operating leverage and path to durable margins
- Free cash flow conversion
- Competitive pressure and pricing durability
Current watchlist ideas (2026)
CRWD, PANW, ZS, FTNT, OKTA, S, NET, NOW, DDOG, SNOW, MDB, TEAM, WDAY, HUBS, MELI, SHOP, ARM, ANET, VRT, SMCI
Example: ServiceNow (NOW)
Why it fits: NOW fits the fast-grower profile because it has a long runway in enterprise workflow automation, strong recurring revenue characteristics, and historically high expectations embedded in the valuation—exactly the Lynch warning zone where execution matters every quarter.
What to watch: subscription growth, large-deal momentum, net retention/expansion, and free cash flow conversion as the company scales.
4. Cyclicals
What they are
Businesses whose earnings rise and fall sharply with economic and industry cycles: industrials, autos, housing, travel, commodities, and parts of semiconductors (especially memory). For cyclicals, timing and balance sheet often matter as much as “business quality.”
What to watch
- Where you are in the cycle (demand, inventories, pricing)
- Capacity additions and industry discipline
- Leverage and liquidity through downturns
- “Peak vs. trough” earnings; avoid paying peak multiples on peak earnings
Current watchlist ideas (2026)
CAT, LYB, ALB, DE, URI, DHI, LEN, PHM, NVR, GM, F, DAL, UAL, BKNG, MAR, FCX, NUE, AA, MU, WDC, STX, SLB, HAL, OXY
Example: Micron (MU)
Why it fits: Memory semiconductors are among the most “Lynch-cyclical” industries. Profitability swings meaningfully with supply/demand and pricing, so the best opportunities often come when the cycle is depressed and improving—not when earnings look perfect.
What to watch: DRAM/NAND pricing trends, inventory levels across the supply chain, capex discipline (industrywide), and guidance inflections.
5. Turnarounds
What they are
Companies that have been punished due to execution, strategy, balance sheet stress, or temporary issues and might recover. The goal is not “perfect growth,” but a shift from “bad” to “less bad” that causes a re-rating. Outcomes can be asymmetric: big upside if the fix works; real downside if it fails.
What to watch
- Liquidity runway (cash, debt maturities, covenant risk)
- A credible fix with measurable milestones
- Early signs: margins stabilizing, cash burn improving, operational KPIs trending
- Catalysts: leadership change, restructuring, asset sales, product inflections
Current watchlist ideas (2026)
INTC, ADBE, CRM, BA, MMM, WOLF, PYPL, DIS, PARA, WBD, PTON, NKE, SBUX, RIVN
Example: Intel (INTC)
Why it fits: INTC is a clear turnaround archetype: the thesis hinges on execution milestones (process roadmap, product competitiveness, foundry strategy) rather than steady compounding. If the fix works, the re-rating can be large; if not, you can get trapped.
What to watch: measurable execution markers (node progress/yields, product competitiveness), capital intensity vs. returns, and whether margins/FCF stabilize as strategy matures.
6. Asset Plays
What they are
Stocks where the market is underpricing valuable assets on or off the balance sheet: stakes in other companies, real estate, infrastructure, brands, subsidiaries, or “sum-of-the-parts” value. What makes an asset play work is usually a catalyst that forces price discovery; spin-offs, sales, breakups, recapitalizations, or buybacks at deep discounts.
What to watch
- Clear NAV/sum-of-parts logic with conservative assumptions
- Management incentives aligned with unlocking value
- Catalysts with timelines (or at least plausible paths)
- Hidden liabilities that offset the “asset value”
Current watchlist ideas (2026)
BRK.B, BN, BAM, KKR, APO, CG, L, ET, EPD, ENB, KMI, WMB, O, AMT, EQIX
Example: Brookfield (BN)
Why it fits: BN is a common asset-play setup because investors often analyze it using net asset value / sum-of-the-parts logic across a portfolio of real assets and operating platforms. The “edge” is spotting when the market price implies a discount to underlying asset value and having a credible pathway for value realization.
What to watch: NAV vs. market price, monetization events (sales/spins), fee-bearing capital growth where relevant, and whether leverage obscures the true asset value.
Note: This is an educational framework and research watchlist; not investment advice.


Leave a Reply
You must be logged in to post a comment.